Neat Image user guide / Device noise profiles / Building profile for a device mode / Using a regular image / Analyzing image noise / Manual profiling
Sub-step B. Fine-tuning analysis
For more accurate noise reduction, it is helpful to measure the dependence between the noise level and the local brightness in different image areas. This dependence should be taken into account if the image noise appreciably depends on brightness (for example, if noise is strong in dark areas and weak in light areas).
The Fine-Tuning Analyzer measures this dependence. The measurements results are displayed by the equalizer in the Fine-Tuning Analyzer box. The equalizer has nine sliders corresponding to the range of brightness from darkest to lightest for each sensor (R, G, B) of the image acquisition device.
 The values of the equalizer sliders correspond to the estimated noise levels in different brightness ranges relative to the rough noise profile. Positive values of sliders reflect higher estimated noise levels and make Neat Image consider more image elements to be noise; negative values reflect lower estimated noise levels and fewer image elements are considered noise in the corresponding brightness ranges.
The Fine-Tuning Analyzer can be used in an automatic and manual way. Below, the automatic method is described first. Then the manual method is explained in details to provide a better understanding of the whole process and result.
Case of automatic fine-tuning
Auto fine-tuning automatically
finds and analyses several flat featureless image areas. You do not need to do anything manually; auto fine-tuning can be done in just one click:
Click  (the Auto Fine-Tuning Analyzer button) or select the Profile | Auto Fine-Tune menu item.
The whole image will be automatically analyzed by Neat Image and some of the equalizer sliders will receive the 'measured' status (see diagrams details). The values of unmeasured
sliders will be then automatically interpolated by the Auto Complete function and will receive the 'manual' status.
You may want to inspect the equalizer values after using
auto fine-tuning. In most cases, there is no need to do manual slider adjustments. If you feel this is necessary (for example if some slider values have red shading – the ‘inaccurate’ status, or the interpolated values exceed the normal range of possible values), please follow the guidelines of the manual fine-tuning subsection below. Otherwise please proceed to Stage II. Documenting the noise profile.
Case of manual fine-tuning
Manual fine-tuning involves analyzing several flat featureless image areas. You have to manually find and analyze them one after another by following the steps below:
1. Find and select a uniform featureless image area
- Scroll, pan, zoom the image in the viewer in the Device Noise Profile tab to find a uniform image area.
- Use Image Viewer Adjustments to find a uniform area in very dark or very bright image areas.
- Use the mouse to select a uniform image area: press the left button, drag the mouse and then release the button.
See examples of uniform image areas.
The size of a selected area should be from 30x30 to 300x300 pixels. The selection frame will change its thickness according to the selection size.  Also, when you are selecting an image area, the selection status in the bottom of the Fine-Tuning Analyzer box is dynamically indicating which frequency components (see what is frequency) are contained in the selected area and would be analyzed: 'high', 'high+mid', 'high+mid+low', 'high+mid+low+very low freqs'.
| Size of an area, pixels | Which frequency components would be analyzed | Rating |
| 200x200 - 300x300 | High, medium, low and very low | Best |
100x100 - 200x200 | High, medium and low | Good |
60x60 - 100x100 | High and medium | Ok |
30x30 - 60x60 | High | Poor |
The selected area would be analyzed according to its frequency composition (of high, medium, low and very low frequency image components). When a frequency component is not analyzed, all the data related to this component are estimated (extrapolated). That is always not precise; therefore, it is best to choose large areas so that all the frequency components could be analyzed.
| Warning |
1) The selection status and selection frame display "signal clipping!" when the image (some of its color channels) is close to the dynamic range limit in the selected area. Fine-tuning a device noise profile using the selected area could be inaccurate. Please try to avoid this for best results. 2) The selection status and selection frame display "area not uniform in ... channel(s)" when the image (some of its color channels) contains some real details or the noise is not uniform in the selected area. Fine-tuning a device noise profile using the selected area could be inaccurate. Please try to avoid this for best results. |
When you select an image area, its position in the brightness range is shown with red font color of the value(s) of the corresponding slider(s)' in the noise profile equalizer. Also, it is displayed by the color indicators in the bottom of the equalizer.
2. Analyze selected image area with Manual Fine-Tuning Analyzer
- Click
 (the Manual Fine-Tuning Analyzer button) or select the Profile | Fine-Tune Using Selected Area menu item.
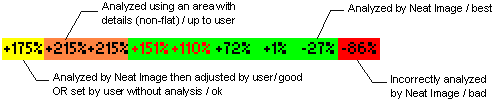
The analysis results are shown in the noise profile equalizer. For regular uniform areas that contain only noise, the corresponding slider receives the
'measured' status - the green shading on the slider's value, like  . If an area with signal clipping has been analyzed then the corresponding slider receives the 'inaccurate' status - the red shading, like
  . When an area with unexpectedly strong level of noise is encountered, the orange shading is applied, like
  .
.
| Warning |
The orange shading is applied when the analyzed noise in the corresponding brightness range is unexpectedly strong. There are several possible reasons for that: - Fine-tuning is being done using a bad (e.g., containing visible details) image area;
- Wrong device noise profile is used (the profile's device and device mode do not match those of the analyzed image OR the rough noise analysis has been done inaccurately);
- Noise in this image is unusual and contains strong variations.
The orange shading is a warning sign. It does not necessarily signify a wrong measurement. Please make you own judgment in this situation and if necessary rebuild the device noise profile or select a more uniform area for fine-tuning. The red shading is a sure sign of a wrong measurement. You have to reset the corresponding slider or undo the last analysis (see below). |
3. If necessary, reset status of a slider (optional)
- Click on the color shading of a slider to reset its status and value.
If a slider has red (or any other color) shading, you can safely reset it and analyze another part of the input image to re-measure its value. There is no need to reset the entire equalizer because of one wrong value.
4. If necessary, undo the last analysis (optional)
- Click
 (the Undo button) or select the Profile | Undo Last Fine-Tuning Analysis menu item.
Undoing the last fine-tuning analysis may be useful when a bad choice of image area has resulted in bad analysis results.
5. If necessary, reset the whole equalizer (optional)
- Click
 (the Reset fine-tuning results button) or select the Profile | Reset Fine-Tuning Results menu item.
6. Repeat 1-5 with other uniform image areas of different brightness
To make a device noise profile more accurate you have to fine-tune it using several uniform areas of the image (naturally, analyzing the same area many times makes little sense). Try to choose uniform areas to cover all brightness ranges in all channels of the equalizer (i.e., to get shadings on all sliders' values). Use color shadings as well as red markings (which are used to reflect the range of the current selection; like -40%) to guide the process of fine-tuning. Also use the color indicators in the bottom of the Fine-Tuning Analyzer box as guidance when doing that. If the majority of sliders' values have green shadings, you can stop the process.
7. Set remaining sliders at your option (optional)
If not set by the Fine-Tuning Analyzer, the sliders of the equalizer have default values. You can leave them with default values or can adjust these sliders to bring them into better agreement with the measured ones. Adjusting the sliders can also be done automatically or manually:
- Manually adjust the remaining sliders as you consider necessary.
Manually adjusted sliders receive the 'manual' status (a yellow shading, like  ).
).
or
- Use Auto Complete to automatically adjust the unmeasured sliders by interpolation based on the measured data. Click
 (the Auto Complete button) or select the Profile | Auto Complete menu item to automatically complete the fine-tuning.
Using Auto Complete is highly advisable as the last step of the manual fine-tuning process.
The figure below summarizes the status marking of sliders:
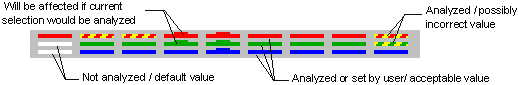
When using the noise profile equalizer, use the color indicator to simplify the fine-tuning process. Colored lines of the indicator show:
- which sliders of the equalizer correspond to the colors of the selected image area/pixel (use the Shift key for pixel-wise indication);
- which slider values are different from default values;
- which sliders have (possibly) incorrect values.
The figure below explains each state of the indicator elements:
| How to check if a device noise profile has been fine-tuned properly |
| The equalizer sliders should be mostly shaded in green and, occasionally, yellow. The color indicators should be filled with solid colored lines at all positions. |
Sub-step A :: Sub-step B